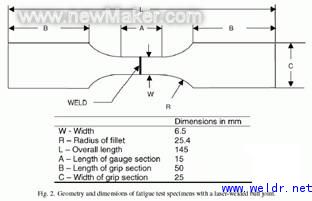
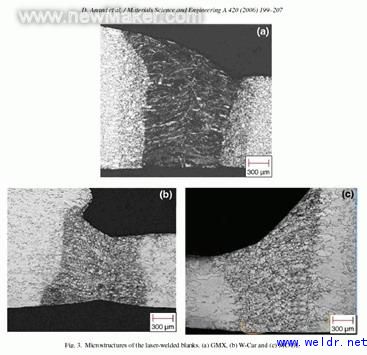
1. Introduction Over the past 20 years, the automotive industry has experienced tight government policies and safety requirements for fuel economy and environmental protection. These regulations have prompted automakers to come up with innovative solutions to design lighter cars that reduce fuel consumption while improving the overall structure of the vehicle for driver safety reasons. One such solution involves the laser-cutting process, which requires a variety of materials to be joined together prior to processing. The concept of selecting the available materials to the tailored panel allows the engineers to cut the panels to ensure optimal placement of the material within the parts they need. There are differences in grade, thickness, strength and plating coating (eg galvanizing/nicking or cooling foil and annealing). The cutting jigs are currently used for the side frame of the car body, the inner panel of the door, the engine compartment bar, the inner panel of the center pillar, and the wheel frame/damping panel. So far, no other materials in automotive applications have demonstrated the diversity of steel. The existing IF steels, DP and HSLA have a good performance in formability and can meet the requirements of most automotive manufacturing. With the challenge of predicting and evaluating the performance of these tailoring processes in terms of forming and other structural properties, the use of these grades of steel has penetrated into the tailored panels. A number of reports on the formation of tailored panels have been documented. In a report in A/SP, it is mentioned that the failure of the tailored blank in the case of fatigue or cyclic loading is a very serious problem for the structural composition. The high cycle fatigue strength of the material depends on surface conditions such as residual pressure, localized pressure concentration and surface protective coating. Residual pressure and other weld defects are introduced into the material during the laser welding process. Since there is only limited data in this area, A/SP has determined that further research is needed in this area. Wang and Ewing [2] compared the fatigue strength of laser and spot welding for uncoated SAE 1008 grade steel. Studies have shown that laser welding has higher fatigue strength than spot solder. Therefore, the goal of this study was to study the fatigue strength and determine the fracture mechanism of IF steel and low carbon steel with different thicknesses of laser welding with and without hot enamel plating. 2. Raw materials and test procedures 2.1 Raw materials The materials selected for the study were IF steel (annealed and hot galvanized) and low carbon steel (cooled foil and annealed). The choice is based on the actual production of a large number of laser welded parts. Based on the name of the part, three different tailoring process combinations are named GMX, W-Car and MC-DI. â— GMX has the smallest thickness difference and maximum production strength difference between two steel plates. Select a base metal (abbreviated as BM) to compare the fatigue strength of the tailored panel. Since the metal composition used in the current study has an average thickness of 1.5 mm, we have selected a base metal having a thickness of 1.5 mm. 2.2 laser welding processing The cutting board originated from Concord Laser Power Co., Canada. The laser is used for the rough end welding of the welded panel. No filler material is used in the laser welding process. 2.3 Sample preparation and microstructure observation Figure 1 shows the geometry of a laser welding test sample. The solder beads are placed in the center, pointing in a direction perpendicular to the loading line. For the base metal, it is the same size as the laser welded sample at the center. The direction of rotation of the material is along the direction of the loading line. Similar geometric shapes were used in other published papers. In order to prevent the peak boundary effect of fatigue strength, the measurement areas of all samples were lightly smoothed by hand using #400 sandpaper. Prior to the fatigue test, the microstructure of the intersection of the samples to be welded is examined under an optical microscope to estimate the quality of the laser welding. The inclusion of the cross-links was initially observed under unetched conditions. The sample was then etched with a 4% Nital etchant to check the microstructure. 2.4 Mechanical testing and microscopic observation of metal sections The microhardness test in welding is performed under a powerful and automated microhardness tester (Clemex MT-2001). A loading of 300 g for a duration of 15 s was applied. Prior to the fatigue test, in order to determine the maximum applied loading value, a tensile test was performed according to the ASTM E8 standard on a single base metal without solder beads. The initial value for fatigue loading is chosen to be about half of the final tensile strength. The tensile properties were determined by a Schenck-Treble tensile tester in speed control mode. Tested on a hydraulic servo Instron8801 fatigue test system with powerful calculations. The test was conducted at a loading of each ASTME 466 standard amount. In order to avoid possible buckles, all samples were limited to a compression cycle at room temperature and perpendicular to the direction of the weld beads. A sine wave with a frequency of 50 Hz was used in the test. In the cycle, no fatigue failure occurs at a certain level of strength, then we define this intensity level as the fatigue limit. We use an electronic scanning microscope equipped with an EDS analyzer to inspect the fracture surface. The EDS analyzer can be used to determine the initial orientation of the fatigue crack and the propagation mechanism of the fatigue crack. 3. Results and discussion 3.1 Microstructure and microhardness Microstructural analysis showed that the welds were not affected by the weld defects such as porosity, concavity, cracks, voids and uncalibrated as shown, and also indicated that the welding parameters selected in Table 3 were reasonable. The average width of the melt zone is about 0.8-1 mm, and the total area affected by heat on both sides of the weld is about 0.7-1 mm. The microstructure of the base metal is composed of equiaxed grain ferrite, and the welded region exhibits fine pearlite and low carbon bainite. Next page
Lazzarin et al. [3] determined the fatigue strength of laser welding of similar thickness under uncoated and hot-dip galvanizing conditions. They concluded that the fatigue strengths of the two combinations are similar. Previous work in this area included basic fatigue-welded panels of similar thickness or the fatigue behavior of tailored panels composed of materials of different thicknesses. For the author's knowledge, there are no comparisons or benchmarks for the different tailoring panels for the rupture mechanism so far.
â— W-Car has the smallest difference in production strength between two steel plates.
â— MC-DI has the largest thickness difference between the two steel plates.